
A Day in the Life
What’s Andover really like? Hear from our students and follow their typical days.
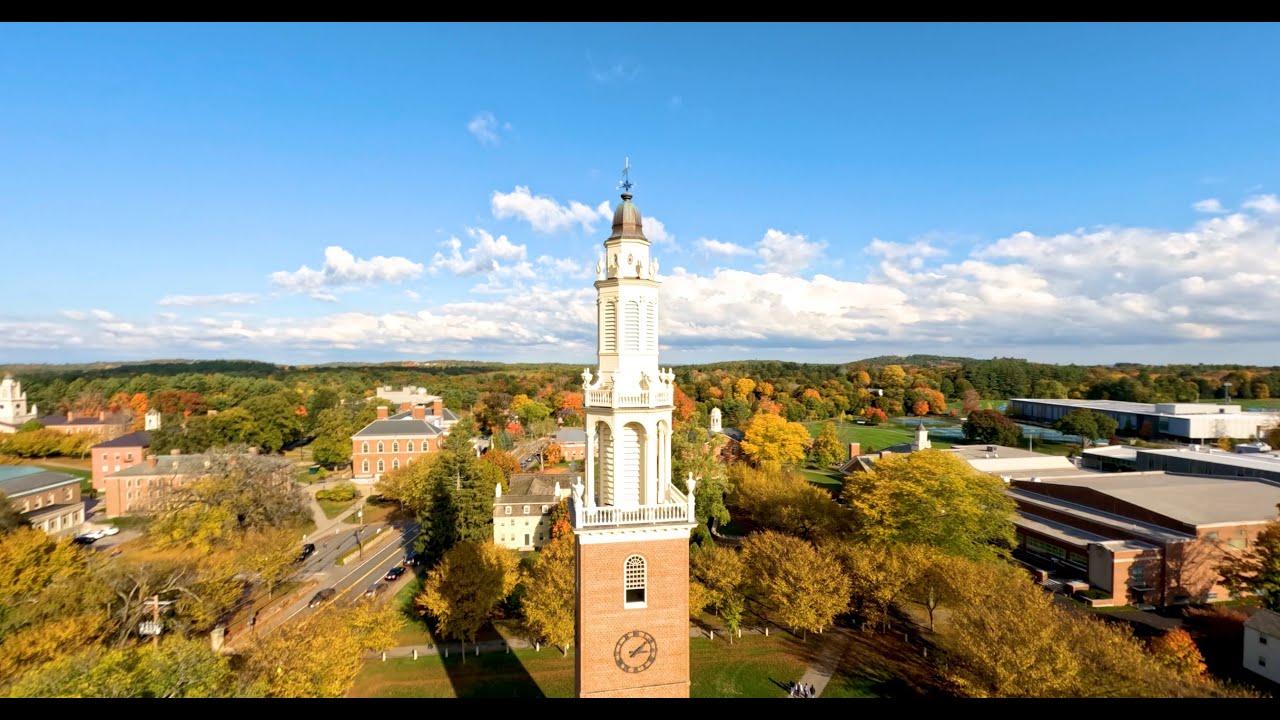

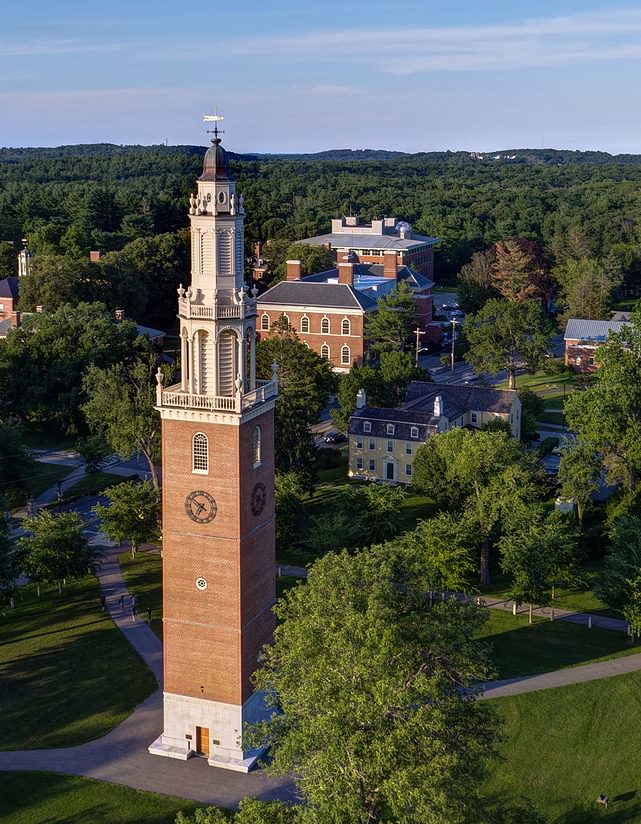
Explore Andover
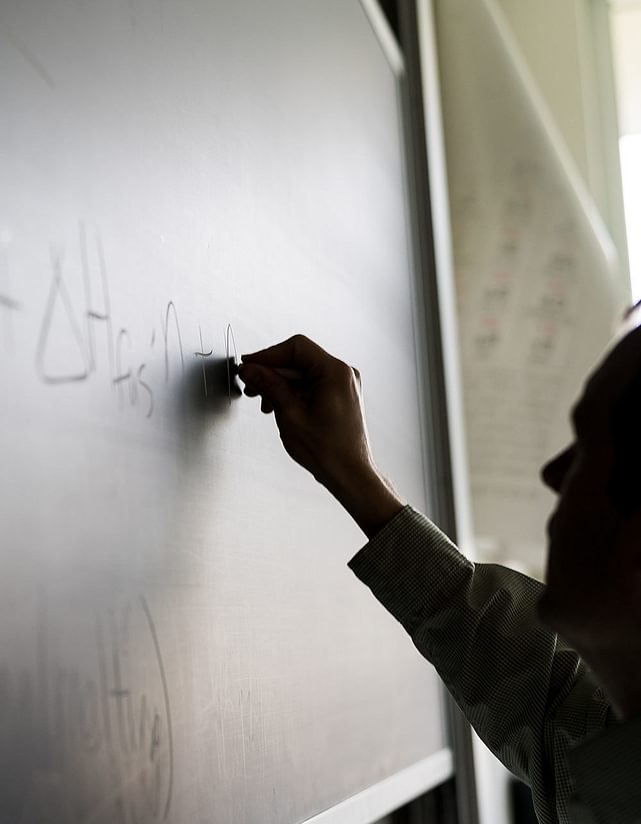
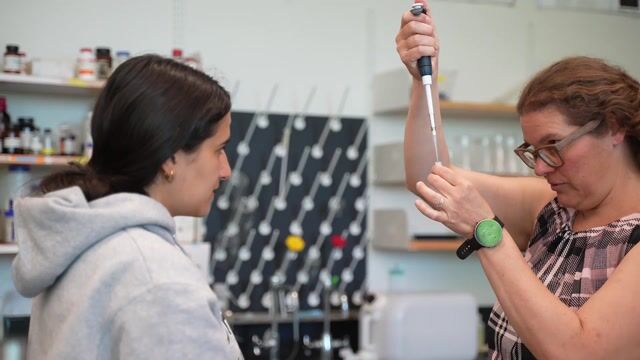
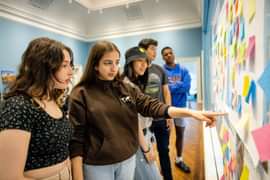
Learning
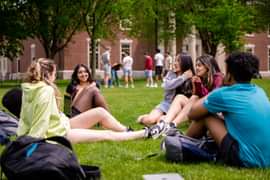
Living
Athletics
Arts
Academics
To prepare its students for life in the wider world, Phillips Academy offers a liberal arts education. Oriented to all aspects of human experience, liberal arts education affirms that knowledge is intrinsically good and denies that education terminates with technical skill or professional success. Resisting specialization in favor of breadth, it initiates students into connected fields of understanding and prepares them to lead lives characterized by learning and understanding, responsibility and freedom.
The practice of responsibility and freedom demands that citizens have dispositions of the critical mind to recognize fact and valid argument and to comprehend the implications of the knowledge they produce and the things they create. It requires that citizens act against intolerance and injustice and build communities conducive to human flourishing. To help students become such citizens, Phillips Academy seeks to prepare graduates who are educated broadly, discerning of ideologies, and committed to the public good.

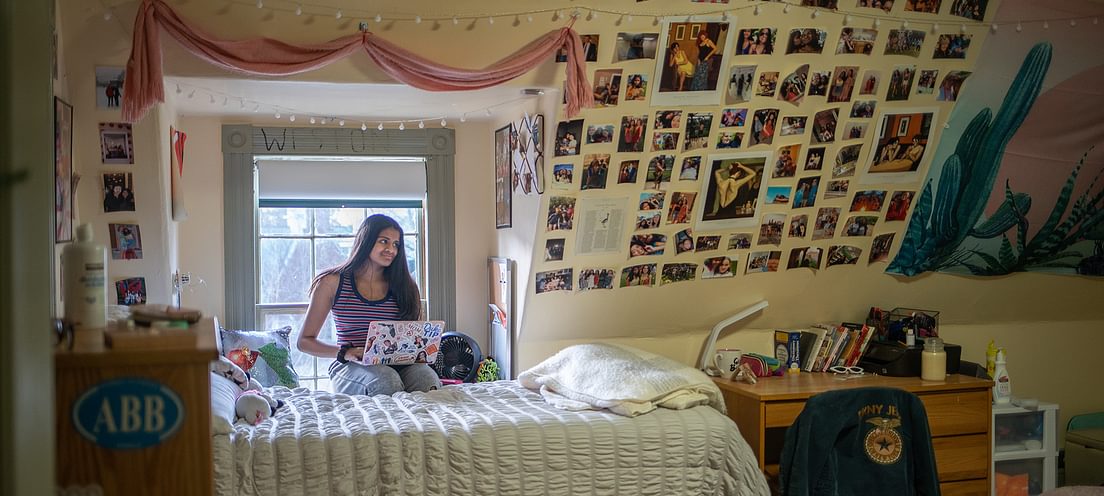
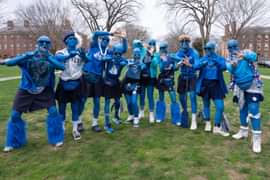
A Place to Call Home
Andover is a vibrant, inclusive, and intentionally diverse community. Some of the greatest lessons our students learn take place outside of the classroom. On the field, at the dinner table, in the common room—your world is what you make it at Andover.
No matter where you’re from or where you live while attending Andover, everyone is part of the Big Blue family. So start that club and try out for the talent show and go downtown for ice cream after a long study session. Andover will be your home away from home.
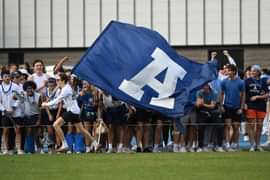
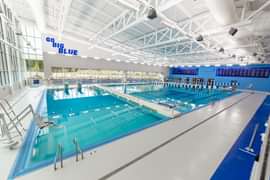
Go Big Blue!
Teamwork, a non sibi (not for self) mindset, and dedication define Andover athletics. Our student-athletes work hard to develop strong technical and tactical skills with a fierce competitive edge. But they also approach the playing field as yet another “classroom” for learning—about themselves and others, about humility and accountability, and about camaraderie and sportsmanship.
Andover offers 70+ interscholastic teams in 23 different sports. Students can also participate in intramural options each season like soccer, basketball, and ultimate as well as wellness activities like dance and yoga.
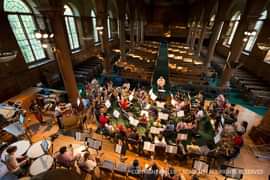
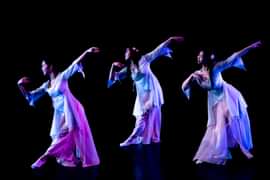
Center Stage
Through our three departments—Music, Art, and Theatre & Dance—we offer the opportunity for all students to express themselves. Find your medium and your mentors in the studio, on the stage, and amongst your peers. We can’t wait to see what you create.
Visual Arts
Courses include art history, painting, printmaking, architecture, photography, ceramics, video and more.

Music
The depth and breadth of the music program supports students who share a passion for music at all points of entry into the program.
Theatre & Dance
The department focuses on technique, craft, expression, and performance.
Team Shuman
The Andover Admission Office is eager to assist you as you search for an independent high school.

Jim Ventre ’79
“No one goes through life at Andover without the help and support of others.”
view full profile [email protected]
Jill Thompson
“It is wonderful to be a part of a community where students, faculty, and staff can feel comfortable being who they are.”
view full profile [email protected]
Heidi Jamieson P’12
“The best part of my job is having the opportunity to speak with families, not only about financial aid but also about themselves.”
view full profile [email protected]
Jessica Acosta-Chavez ’06
"One of my favorite things is seeing a student light up when they talk about their passions."
view full profile [email protected]
Pete Dignard ’07
“Andover is a place where it is cool to be smart and kindness matters.”
view full profile [email protected]
Sarah H. Carroll
“I’m really excited to be part of a residential community again. I’m thrilled to immerse myself in all aspects of boarding school life.”
view full profile [email protected]
Terrell Ivory ’00
While working as director of Basketball Operations at Davidson College, TI shared the bench with a young Steph Curry.
view full profile [email protected]
Lela A. Paultre
Assistant Director of DEI Outreach & Assistant Director of Admission
view full profile [email protected]

Charles V. “Trey” Brown ’12
Complementary House Counselor in Taylor House and Varsity Football Coach
view full profile [email protected]
Timothy Liu
“There are so many opportunities to learn and grow in a community that values curiosity and kindness.”
view full profile [email protected]


Rev. Gina M. Finocchiaro ’97
Rev. Gina Finocchiaro is ordained in the United Church of Christ and is deeply involved in social justice issues.
view full profile [email protected]
Andrea Prescott Gerakaris P’22, ’24
Business Manager, Admission & Financial Aid; parent of Ethan ’22 and Caleb ’24
[email protected]


Stacey Murphy P’23
Welcome Ambassador and Administrative Assistant; parent of Joe ’23
[email protected]